Updated 4 October 2026 with the late-September CPU prices.
On the first production call over our own phone line, a bot sent some of its audio packets up to 126.6 ms late, on a clock that has to tick every 20 ms. The cause was one of our Kubernetes CPU limits: half a core, on a container that uses about a quarter of one. The limit saved us nothing, because machines are packed by the CPU request, not the limit. What it did do was freeze the whole container, sender thread included, whenever a burst of model work used up its 50 ms of CPU in a 100 ms window. Raising the limit to one core and pinning our math libraries to one thread each brought the clock back to its baseline the same day, on the same number of machines. We caught it because the sender counts its own late ticks on every call, and you can check your own containers with one ratio from the kernel: nr_throttled / nr_periods.
On your own phone line, you are the clock
Until September 2026, every call reached our bots through a phone provider whose media servers sat between the caller and us. They set the pace of the audio, and if our side hiccuped for a moment, they smoothed it over before it reached the caller. When we started connecting calls over our own SIP line, that middle layer went away. Every call runs in its own bot (how a call gets one), and the pace of the agent's voice on the wire is now set by one thread in that bot. Nothing downstream re-times it.
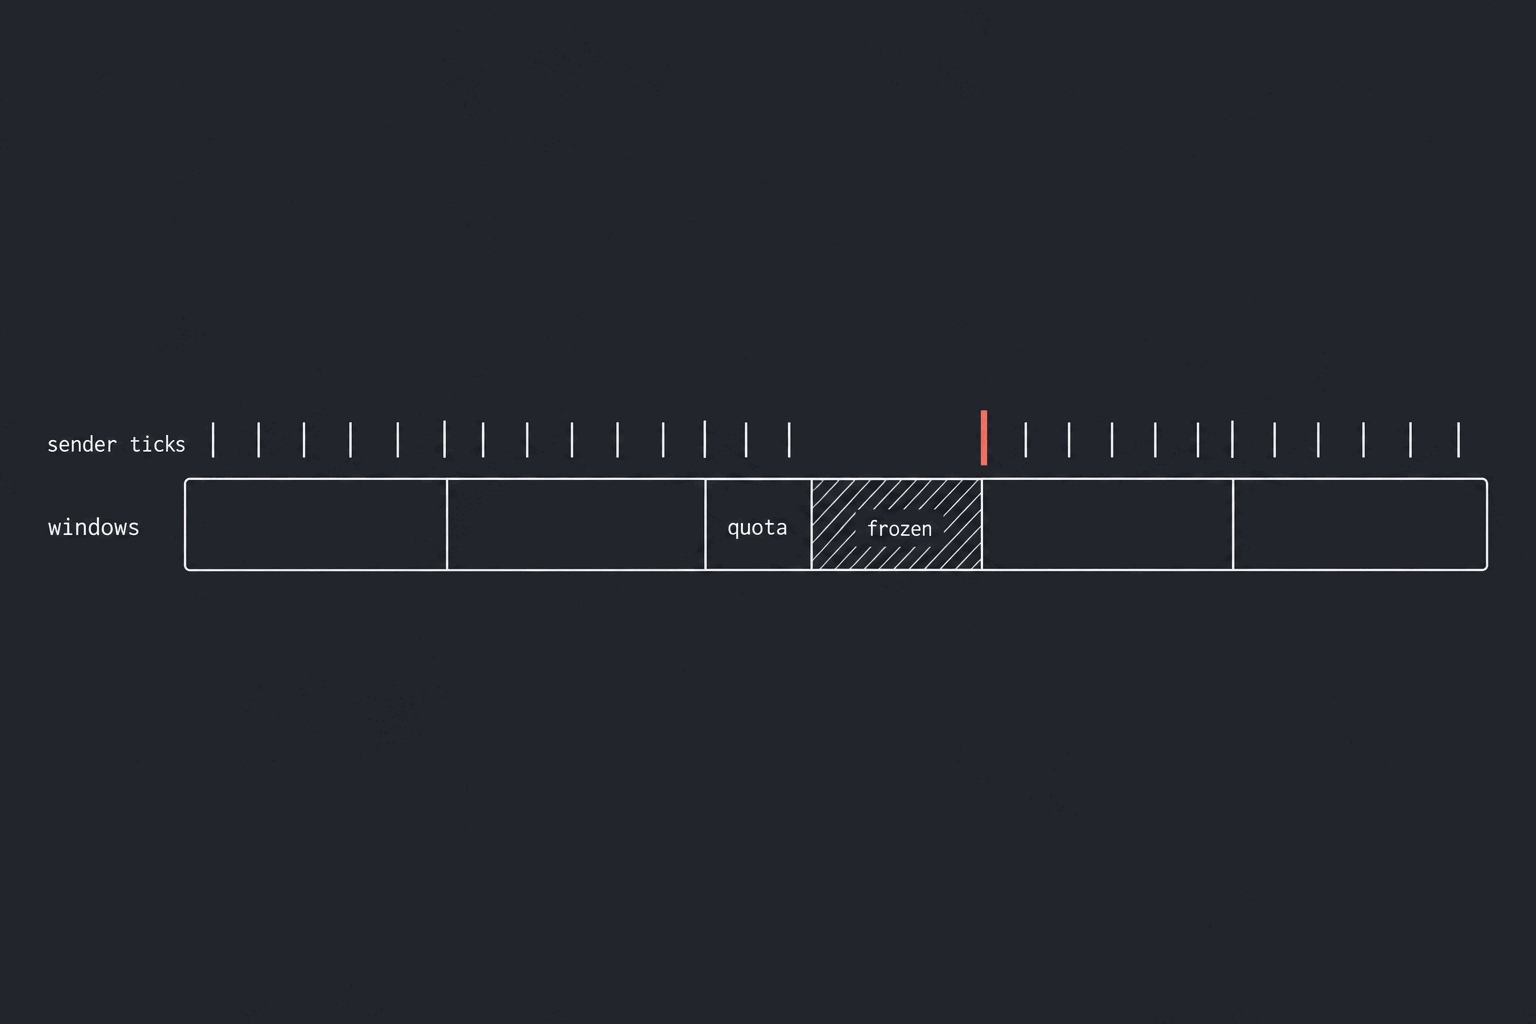
Phone audio travels as RTP packets, each carrying 20 ms of sound: 160 bytes of 8 kHz audio. The sender wakes fifty times a second and puts the next packet on the wire. Each wake-up is a tick, and a tick is late by however long after its 20 ms slot it actually fires. We count every tick more than 20 ms late, because at that point a whole packet's slot has passed.
The phone at the other end keeps a small jitter buffer, and a packet that misses its moment does not wait. RFC 3611 defines the receiver's discard count as packets "discarded since the beginning of reception, due to late or early arrival, under-run or overflow at the receiving jitter buffer", and says lost and discarded packets have an "equal effect on the quality of the voice stream" (RFC 3611 §4.7.1). The receiver fills the hole with a guess. One guess is a glitch nobody notices; a run of them is a word that never arrives.
That is why "126 ms late" and "zero packets lost" are not a contradiction. Loss is what the network drops; a late packet arrives intact and may still be thrown away. Our carrier sends standard RTCP receiver reports, which count loss but not discards (those need the RFC 3611 extensions), so we cannot tell from the far end what the caller heard. We can only keep our own clock honest.
Why our Kubernetes CPU limits saved nothing
We profiled our bots on live calls in September 2026: while talking, one uses 0.24 to 0.27 of a core. So each bot requests 0.3, and since the scheduler packs machines by the request, that number decides how many bots share a machine. The limit, the ceiling a container may burst up to, was 0.5. It looked like a cheap guard rail next to a request that close. It saved nothing: the request had already set the density, and the limit only took away burst room.
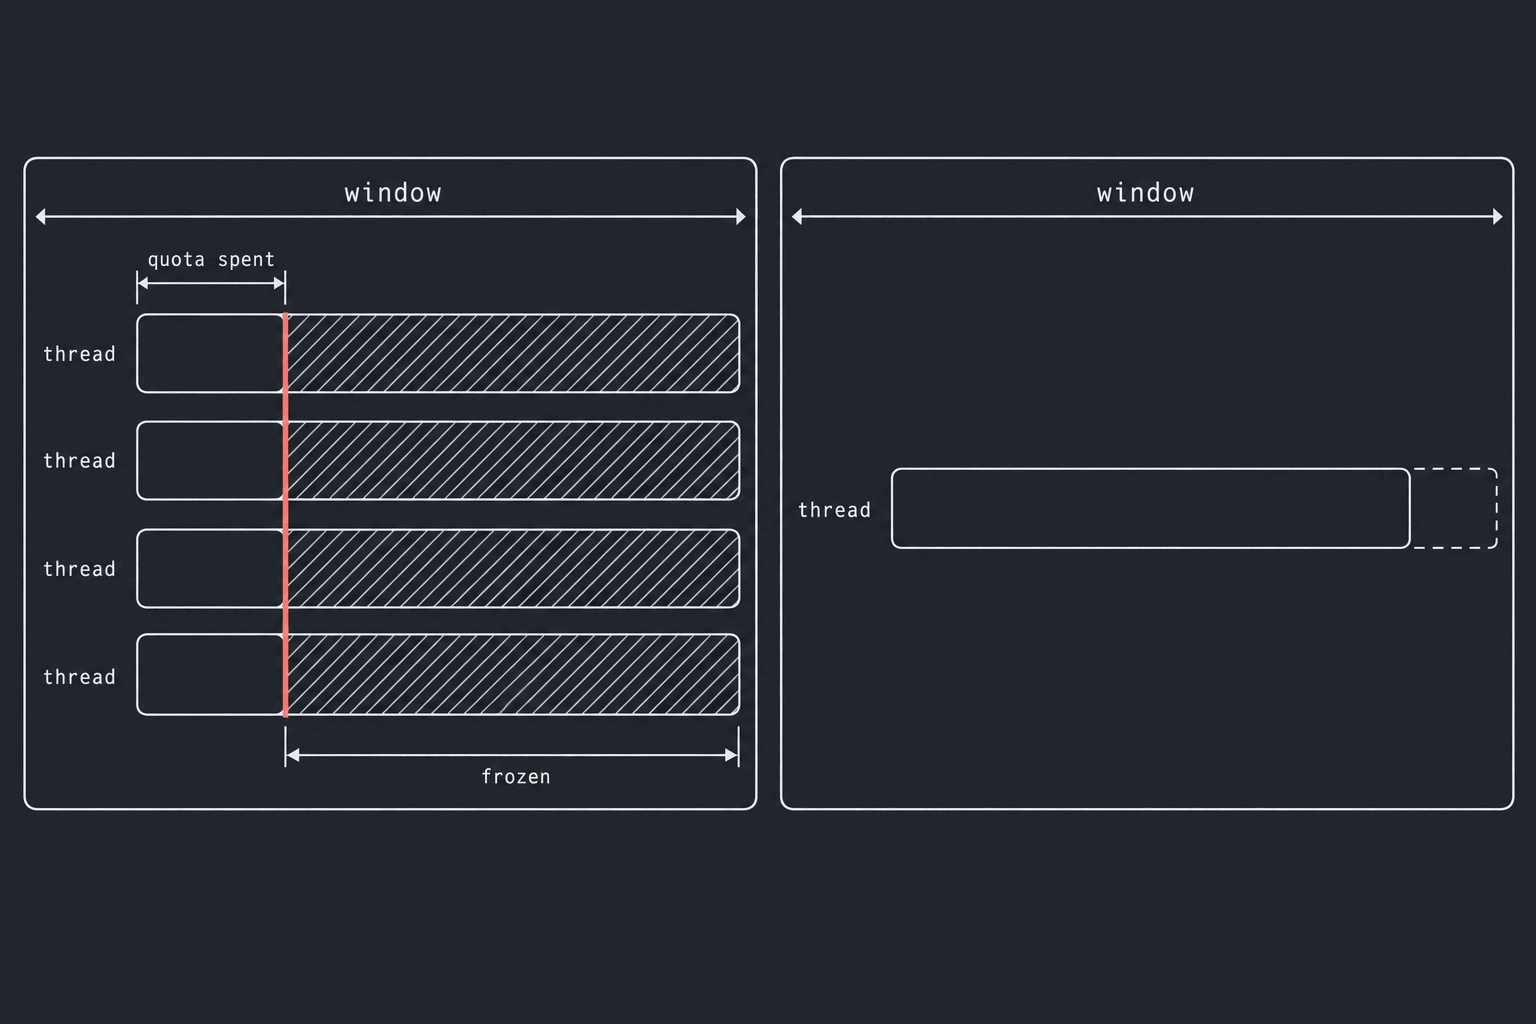
The limit is enforced by the Linux scheduler's CFS quota. Time is cut into windows, 100 ms by default, and a 0.5-core limit allows the container 50 ms of CPU in each one. The kernel documentation is blunt about what happens when it is spent: "Throttled threads will not be able to run again until the next period when the quota is replenished" (kernel docs, CFS bandwidth control). That covers every thread in the container, including the one that sends audio.
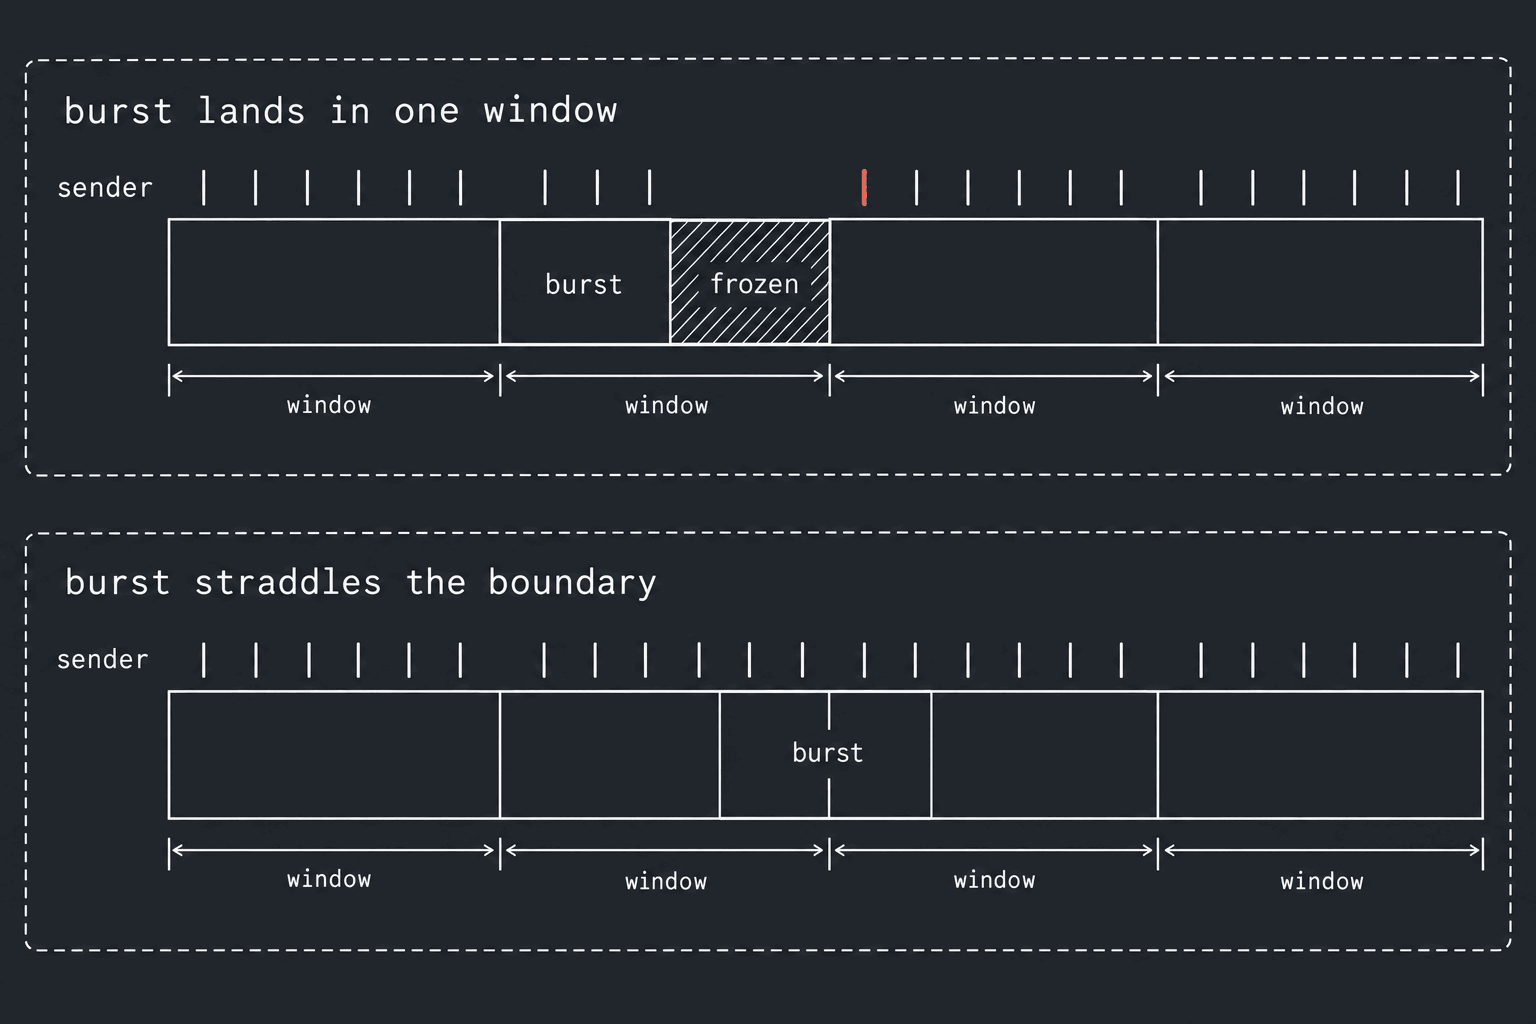
A voice bot's CPU use is not smooth. It idles, then runs a burst of speech-detection and turn-taking inference, then idles again. Averaged over a second it sits well under the limit. But a burst that lands in a window where the container has already spent most of its quota exhausts it, and the sender stops until the window ends. The same burst landing across a window boundary splits in two and fits. That is why it looked fine in testing.
131 throttled windows on the first call
The first production call over our own line ran for 198 seconds on 21 September 2026: about 10,000 packets each way, none lost, and the bot's playout buffer never ran dry. But 149 sender ticks were more than 20 ms late, and the worst by 126.6 ms. On staging, the same build kept its worst tick between 0.6 and 2.3 ms.
The container's own counters gave the cause straight away. Its cpu.stat showed nr_throttled 131: in 131 windows of that call, the bot had run into its limit. Staging ran the same bots with a 1-core limit and had zero throttled windows.
We then reproduced it on purpose. On a 4-core ARM staging machine, a test container ran a 20 ms sender and fired bursts of 60 ms of CPU work at random moments, for 60 seconds per run. Average CPU use was 30 % of a core in every run. Only the limit changed, and how many workers each burst was split over. The workers are processes standing in for a math library's threads; the CPU quota counts both the same way:
| Limit | Burst split over | Windows throttled (of 600) | Ticks > 20 ms late (of 3,000) | Worst tick |
|---|---|---|---|---|
| 0.5 core | 1 worker | 193 | 10 | 45.0 ms |
| 0.5 core | 4 workers | 274 | 365 | 80.7 ms |
| 1.0 core | 1 worker | 0 | 0 | 3.5 ms |
| 1.0 core | 4 workers | 0 | 0 | 13.8 ms |
The average never moved, so a dashboard of CPU utilisation would show nothing in any of the four runs. Not every throttled window costs a tick: with one worker, most freezes were short and ended before the sender's next slot came due. Spread across four workers, the same work spent the quota faster and the freezes got long enough to swallow slots. The 4-worker run at half a core is the dangerous one: one tick in eight missed its slot.
What would the caller's phone have done with that run? We replayed its per-tick lateness against a receiver with a fixed 40 ms jitter buffer and a perfect network. 176 of the 3,000 packets (5.9 %) would have arrived too late to play and been thrown away, in runs of up to three packets: 60 ms of audio in a row. That is a best case. A real network only adds delay on top, and an adaptive buffer would stretch to absorb the late packets, which the caller hears as added delay instead of gaps.
Get the data. Every tick of all four runs, as CSV and as the raw output, with a README that explains each field: download the data (75 KB zip).
Raising the limit was not enough
We raised the production limit to one core the same night, and the next call came back clean: worst tick 0.3 ms, none past 20 ms. The next long one did not. At one core, a 5-minute call still had 114 ticks more than 20 ms late (worst 73.7 ms), and its container had been throttled 70 times.
The second cause was the same family. The numeric libraries under our models (OpenMP, MKL, OpenBLAS and PyTorch's own thread pool) start one worker thread per CPU they can see, and a container sees every core of the machine it runs on. So one small inference fanned out across several threads at once and spent a whole window's quota in a fraction of the window: four threads burn one core's 100 ms in 25 ms of wall time, and the container then waits out the other 75. Our staging bots had four environment variables that pin those libraries to one thread. Production had missed them on promotion, because promotion moved the image and not the configuration around it.
env:
  - name: OMP_NUM_THREADS
    value: "1"
  - name: TORCH_NUM_THREADS
    value: "1"
  - name: MKL_NUM_THREADS
    value: "1"
  - name: OPENBLAS_NUM_THREADS
    value: "1"
With those in place, the next call carried 13,900 packets with a worst tick of 10.2 ms, none past 20 ms, and two throttled windows instead of 70.
We were far from the first to hit this. In a 2019 report on oneTBB, the same NumPy eigenvalue computation inside a container limited to two CPUs on a 48-thread host took 22.7 s with OpenMP's thread pool left to size itself and 1.48 s with it pinned to two threads (oneTBB issue #190). Go changed its runtime default for exactly this reason in 2025. Its proposal put it this way: "An application with a CPU quota of 8 and GOMAXPROCS=64 can quickly hit its quota and throttle (all threads descheduled) until the end of the period, which causes direct latency impact" (golang/go#73193); since Go 1.25, GOMAXPROCS defaults to the CPU limit when that is lower than the number of logical CPUs.
Measure CPU throttling in windows, not seconds
You can check this for your own containers today. Inside a container on cgroup v2, the kernel keeps a file of CPU counters:
cat /sys/fs/cgroup/cpu.stat
# nr_periods     windows that have passed while the container was runnable
# nr_throttled   windows in which it ran out of quota
# throttled_usec time its threads spent throttled
The ratio nr_throttled / nr_periods is the number to watch. Indeed's engineers, who found the 2018 kernel regression described below, used the same measure: "We divided nr_throttled by nr_periods to find a crucial metric for identifying excessively throttled applications" (Indeed Engineering, 2019). Read it before and after a call. If it moved, your clock may have moved with it.
The trap is throttled_usec. It reads like wall time, and it is not. When a container is unthrottled, the kernel adds the throttled time once for every CPU the container's threads were queued on (cfs_b->throttled_time += … in kernel/sched/fair.c). On a 4-core machine it can approach four times the real stall. We misread it ourselves while preparing this post, and several popular guides still describe it as the time a container spent frozen.
The limit itself lives next door, in cpu.max, and its unit needs care too. Kubernetes counts one CPU as one vCPU, and a vCPU is not the same thing everywhere. On AWS Graviton, "every vCPU on a Graviton processor maps to a physical core, and there is no Simultaneous Multi-Threading" (AWS Graviton guide). On Intel instances with hyperthreading, "each thread is represented as a virtual CPU" (AWS EC2 docs), so the half core a 0.5 limit buys is time on hyperthreads whose physical cores are shared with a neighbour. Our bots run on Graviton. On AWS's own price list published 25 September 2026, a physical core on demand cost about $0.045 an hour on c8g and $0.102 on c7i in the same region, around 2.2 times as much, while per vCPU the two look almost the same.
Keep a limit, with headroom
Search for this problem and the first thing you will find is the advice to remove CPU limits altogether. Much of it traces back to a different failure. From 2018 until a fix in late 2019, a kernel bug throttled highly threaded containers that were not using their quota: per-CPU slices of it expired unused. Dave Chiluk at Indeed tracked it down, and his fix "lowered worst-case response latency in one of Indeed's applications from over two seconds to 30 milliseconds" (Indeed Engineering). Our bots ran on a kernel with that fix and really did spend their quota. The remedy for that bug was a kernel upgrade, and Eric Khun's post on removing limits at Buffer, the one most often cited for a "22x faster" landing page, says so itself: "You should prefer upgrading your kernel version over removing the CPU limits" (Eric Khun, 2020).
The case for keeping them is put well by Denilson Nastacio: "Developing containers without CPU limits often leads to invisible dependencies on spare CPU cycles that may not be available across different environments" (Nastacio, 2022). For us the argument is simpler. Many bots share a machine, each holding a live call, and one runaway process should not be able to starve its neighbours' clocks.
So we kept a limit and sized it from the window, not from the average. The rule: in one 100 ms window, the container's steady work plus its largest burst, multiplied by the threads that burst runs on, has to fit inside the quota. A talking bot spends about 27 ms of CPU per window; the bursts in our reproduction were 60 ms of CPU on one thread. That needs 87 ms per window, which is less than one core's 100 ms. Half a core's 50 ms never fit. The request is still 0.3, so the scheduler packs the same number of bots per machine and the fix cost no hardware. Headroom only works while the neighbours don't all burst at the same moment, so the sender still counts its late ticks on every call.
Developers
Turn detection that doesn't talk over you
How our voice agent's turn detection decides a caller has finished, when an interruption is real and when to stay quiet, and the incidents behind it.
Integrations
Meta lead ads, called on arrival and reported back
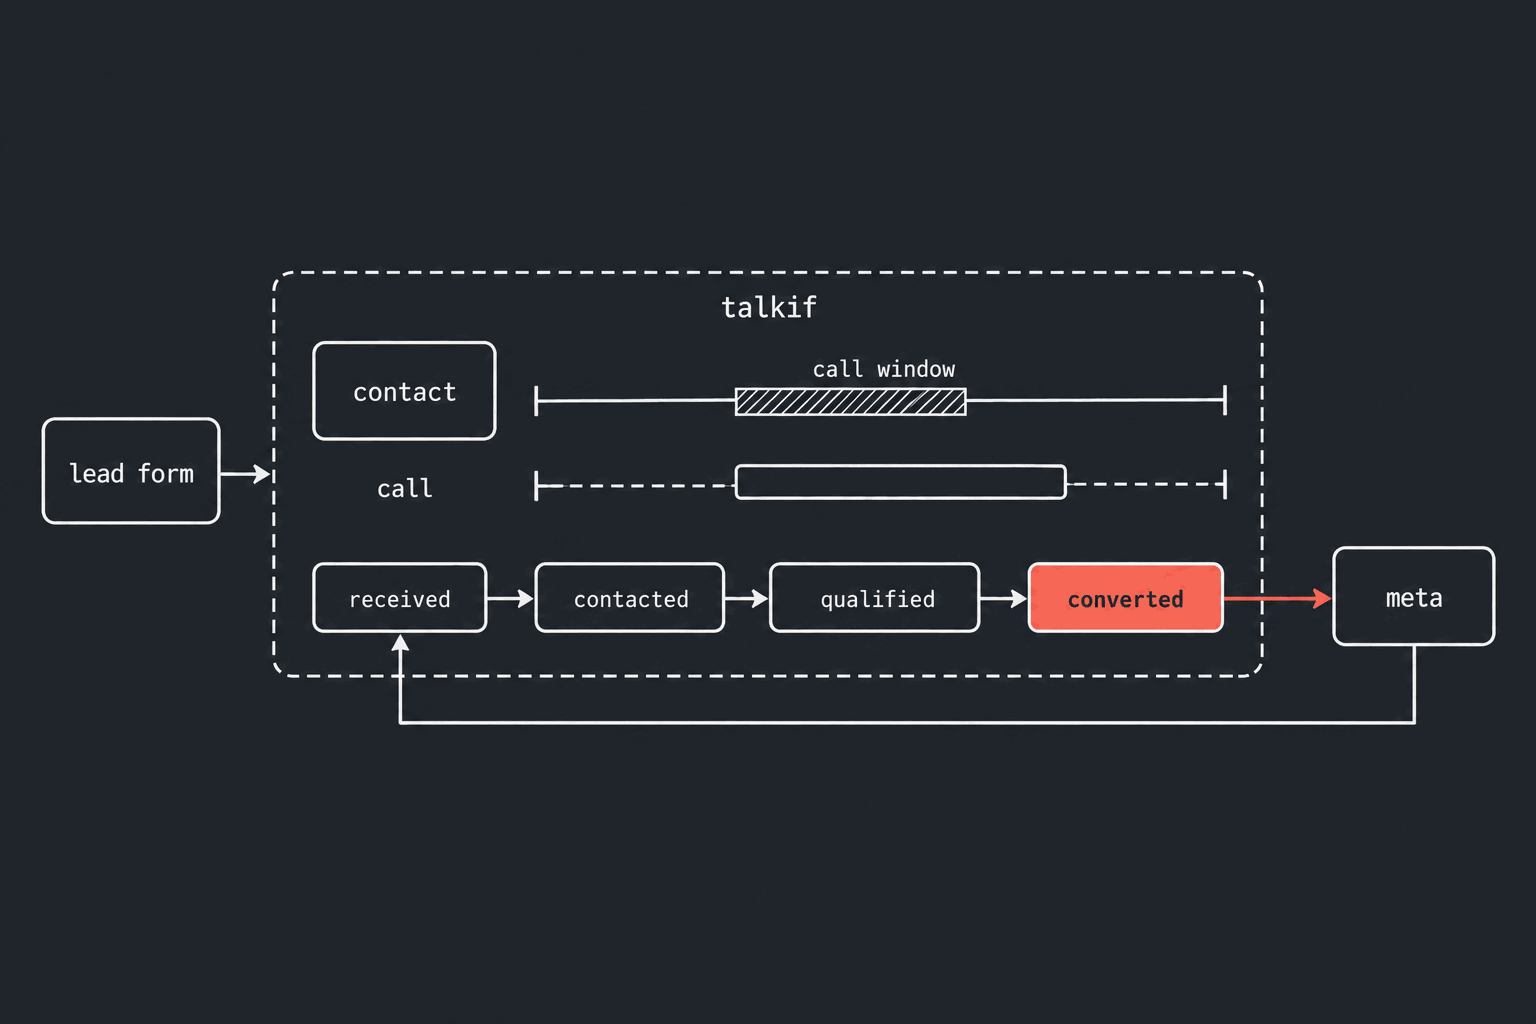
Connect Meta lead ads to Talkif: each lead is called within your calling hours, and received, contacted, qualified and converted go back to Meta.
Developers
Webhook SSRF, closed by a sender that holds nothing
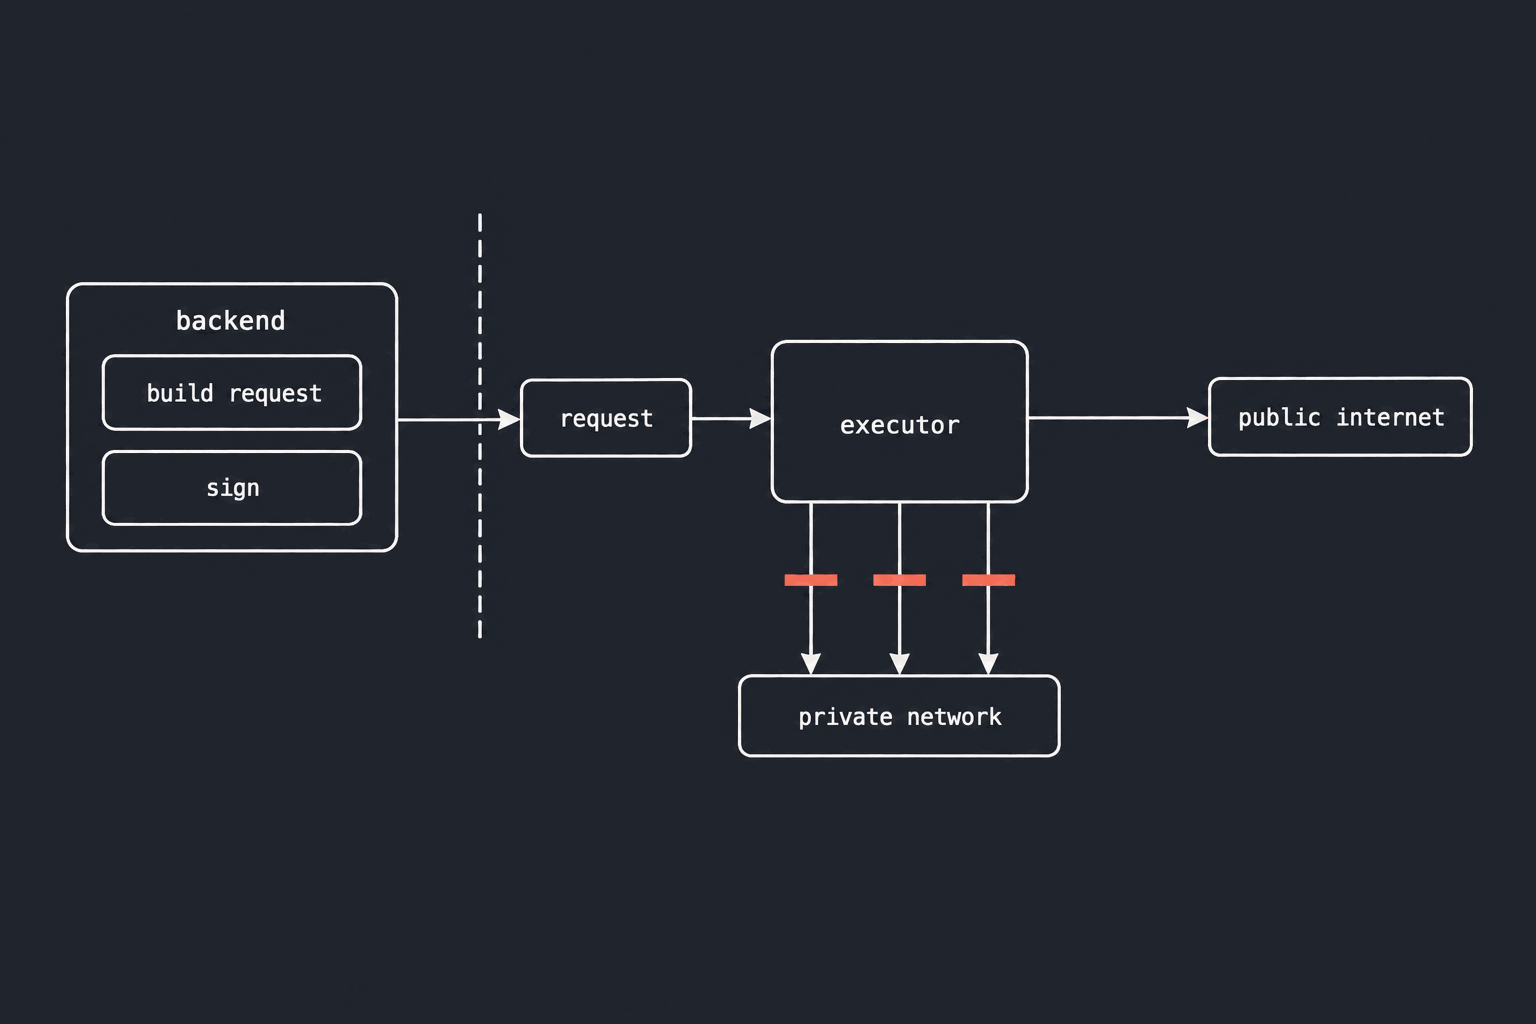
Webhook SSRF closed twice: the process with your secrets never sends, and the process that sends can reach only the public internet.
Developers
Voice agent function calling with bound parameters
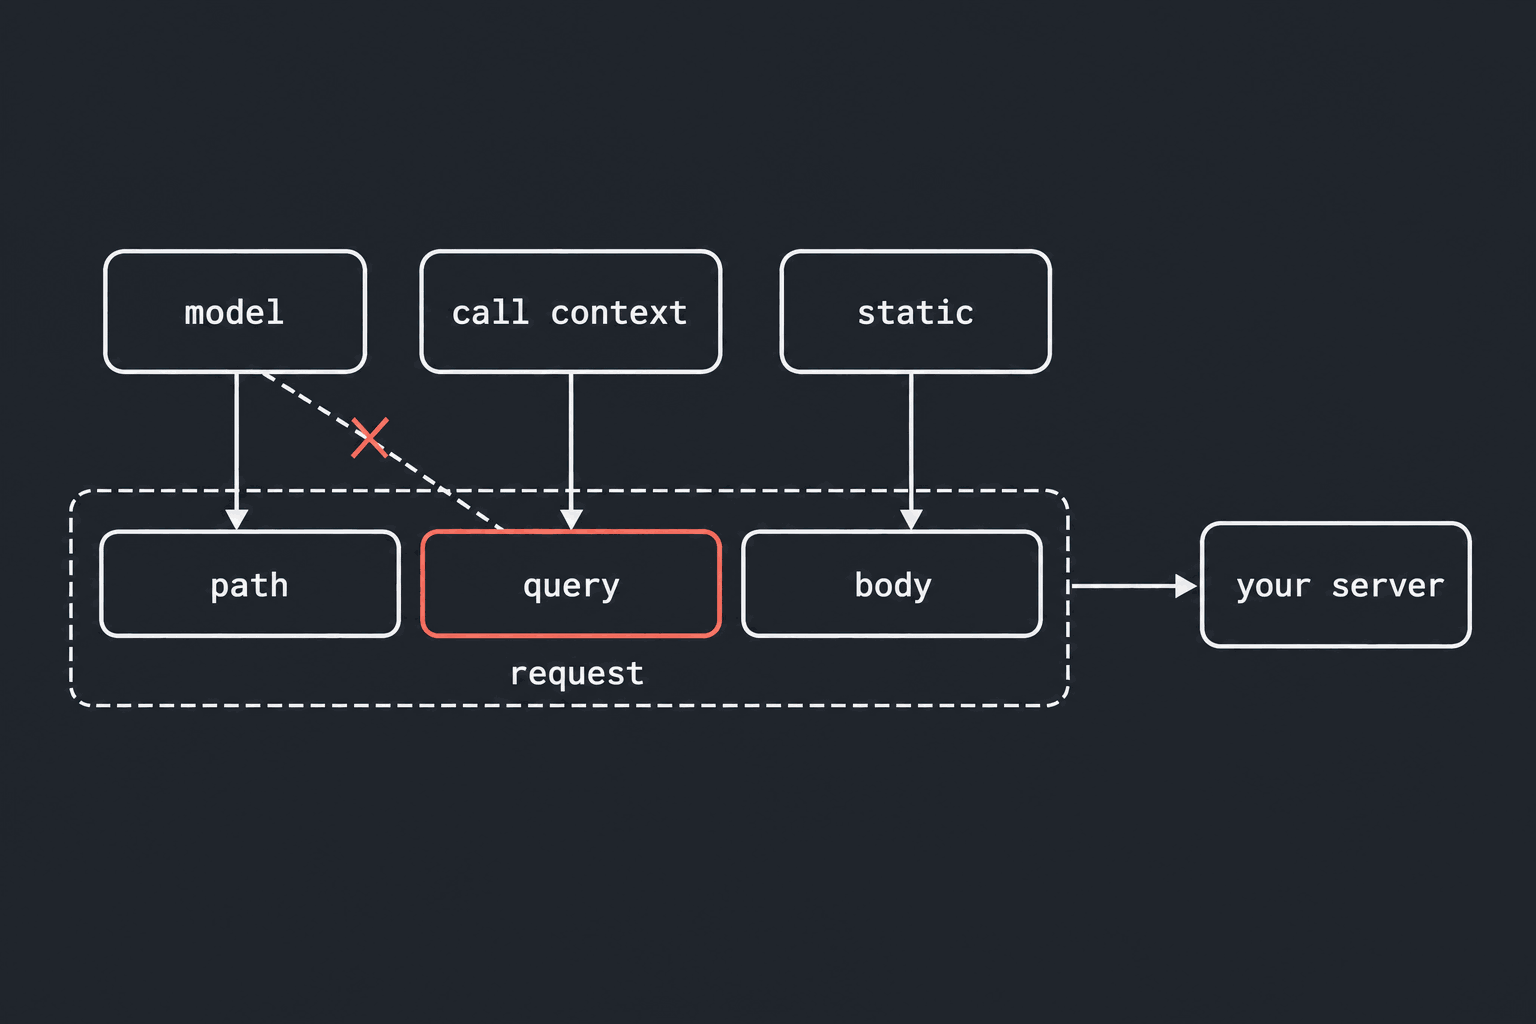
Voice agent function calling on Talkif: describe the endpoint once, then bind each parameter to the model, the call or a fixed value no caller can spoof.
Questions about this piece? Write to us.